


Deep Learning in Cardiology: Understanding Interpretability
Deep learning (DL) has the capability to transform the ECG into a digital biomarker for early detection and intervention of cardiovascular disease. Addressing when and how to interpret DL algorithms is an important topic in this new and growing field.
Deep learning is a subdiscipline of artificial intelligence (AI) that uses deep neural networks (DNN) to extract patterns from raw data to perform a task. It has the potential to transform cardiovascular care with applications ranging from arrhythmia detection, early disease diagnosis, workflow optimization, intervention support, research, and more. Recent studies have shown that DL has the ability to outperform conventional algorithms with expert overreads¹ and can enable faster ambulatory ECG analysis².
Convolutional neural networks (CNNs) are a form of deep learning that have become widely used for a variety of applications in medicine, including predictive biomarkers that can identify diseases beyond the human eye. While deep learning has shown the ability to perform a number of tasks with improved accuracy and efficiency, it still faces a number of challenges. One in particular is model interpretability.
CNNs can have millions of parameters and come from a group of algorithms known as “black boxes”–i.e., humans are unable to understand how the network makes its decisions. Newly developed algorithms that can identify subtle patterns in ECGs not routinely reported or known may require a higher level of trust from the algorithm and its decision before widespread clinical adoption is achieved.
Interpretability of DL, particularly CNNs, has become an active and growing area of research. Gradient-based saliency, input perturbation, and adversarial robustness are among the common approaches designed for model interpretation. In this article, we will explore one in particular: Guided Gradient Class Activation Mapping (Guided Grad-CAM)³, which is a technique that can be used to help identify regions from an ECG that are most important for a model’s prediction.
Case study: How deep learning can detect atrial fibrillation during sinus rhythm
Deep learning has the ability to analyze large amounts of data and uncover new patterns previously unseen by experts. Several studies have shown that deep learning can detect silent Atrial Fibrillation (AFib) from ECGs acquired during normal sinus rhythm⁴’⁵. This can improve patient care by enabling earlier detection and intervention for those at high-risk who would have been previously missed in the clinical pathway.
However, if a diagnosis is made by an algorithm, physicians and patients alike may want to know why. Similarly, in the case of a misdiagnosis, identifying how or why they happen is essential to improve patient outcomes. To demonstrate, we will use a CNN that has been trained to perform the task of detecting atrial fibrillation from sinus rhythm and evaluate how a tool like Grad-CAM can help us interpret the model’s decisions.
Primer on Grad-CAM
Convolutional neural networks use filters to extract and analyze features that can be used for classification. To identify the most important features a CNN extracts, we can use a technique called Guided Grad-CAM. It is composed of two algorithms:
- Grad-CAM: which uses the features extracted by the CNN to capture the most discriminative segment of the ECG
- Guided Backpropagation: which captures only timestamps from the ECG that positively contributed to the prediction
When we combine both algorithms, we capture the most important (salient) regions of the ECG that contribute to the final prediction.
Simply, we will ask the network a question: if I modify this region of the ECG, will the prediction change? If yes, the region influences the networks decision. If no, the region has no effect on the decision. We can visualize this using a saliency map, which is a heatmap overlaid on the original ECG to highlight regions contributing to the model’s prediction.
Saliency maps
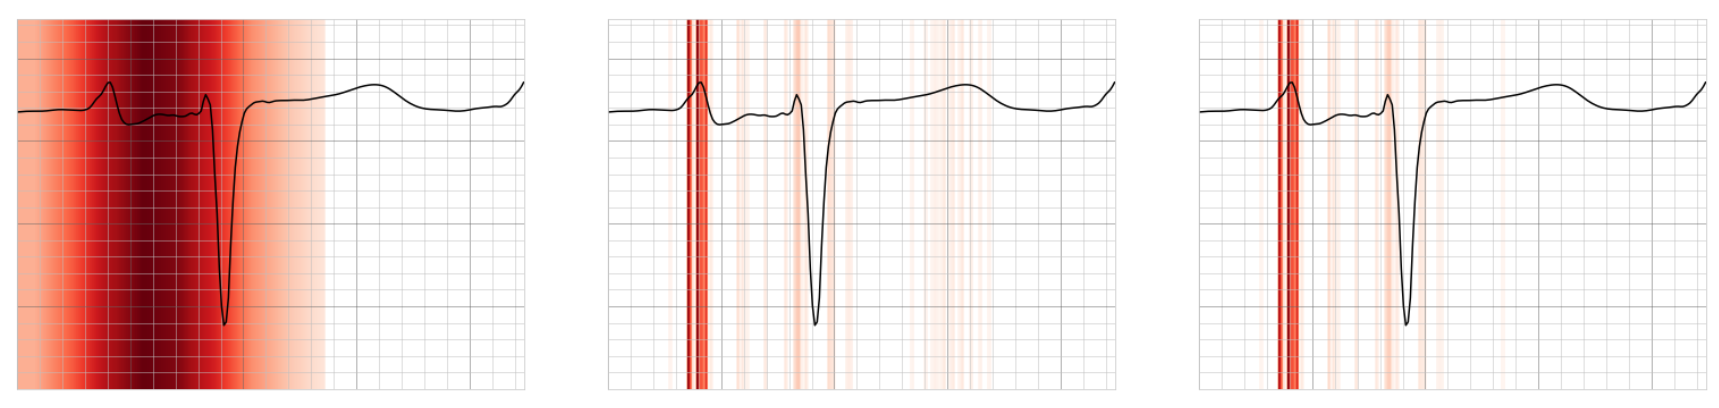
Fig 1. Left to right: Example of what Grad-CAM, Guided Backpropagation and Guided Grad-Cam saliency maps may look like for a single beat from a patient with silent atrial fibrillation. Regions highlighted in red signify stronger saliency.
Grad-CAM (left) saliency map shows the most discriminative segment of the lead, including the P wave and QRS. Guided Backpropagation (middle) saliency map shows the most important fine-grain features of the lead – predominantly the P wave. A combination of the two gives a high-resolution discriminative saliency map, Guided Grad-CAM (right).
Subgroup Analysis
We can aggregate saliency maps of many ECGs with similar abnormalities or arrhythmias to visualize patterns among subgroups. We can also compare saliency maps from patients with silent AFib (positive) versus patients with no history of AFib (negative). This can allow us to develop a general understanding of the model’s behavior.

Fig 2. Side-by-side lead V1 comparison with averaged saliency maps of beats extracted from positive predicted samples (left) vs negative predicted samples (right) – all including left atrial enlargement (LAE). For both groups, the model focuses on the P wave.
However, we can see a difference in the P wave morphologies of the positive group versus the negative.
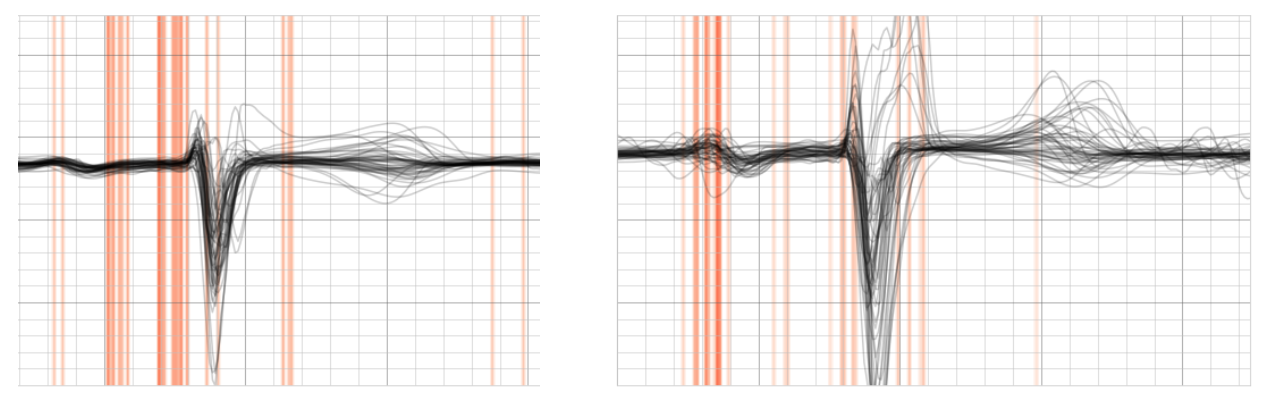
Fig 3. Side-by-side lead V1 comparison with averaged saliency maps of beats extracted from positive samples (left) vs negative samples (right) – all including first degree AV-block.
The positive group shows most saliency around the P wave while the negative focuses along the PR segment.
Interpretability in Practice
Aggregating saliency maps across cohorts can give us a general understanding of the model’s behavior, however, we can also visualize individual ECGs. A heatmap overlaid on a 12-lead chart can serve as a clinical tool to assist during interpretation of ECGs that require further review.
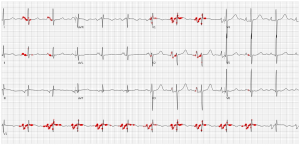
Fig 4. An ECG presenting left atrial enlargement. The P wave and PR segment in lead V1 appear as the most salient features for a patient at risk of silent AFib by the model.
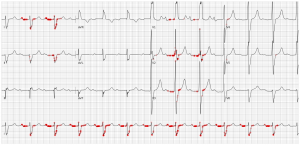
Fig 5. An ECG presenting first degree AV-block. The most salient region appears to be along the PR segment of lead I, which may indicate this patient is at risk of silent AFib.
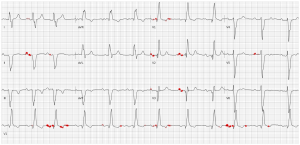
Fig 6. An ECG presenting first AV-block and right bundle branch block. Here we see the model is focusing specifically on the 3rd and 10th beats of lead V1, which at first glance might not appear obvious. However, with closer inspection we can see larger P wave negativity (1 mm) from these beats, which can be a predictor for a number of outcomes⁶.
Prediction of Atrial Fibrillation from Holter ECGs
Our latest Cardiologs study using the first 24-hours of a Holter monitor to predict if a patient will have atrial fibrillation in the following 14 days, provided saliency maps to visualize the behavior of the CNN⁵.
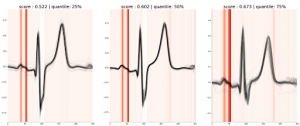
Fig 7. Saliency map for 3 samples of a true positive from the Holter model (predicted score: 0.59)
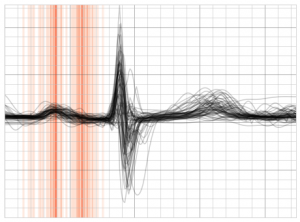
Fig 8. Averaged saliency maps of true positive beats (lead II) extracted from the resting model
For Holters with a positive prediction of AFib, the model appears to highlight the presence of bifid P waves with saliency focused on both modes of the P wave. The presence of biphasic P waves in inferior leads has been shown to be associated with development of AFib in previous studies⁷. Similarities observed across different models trained on different datasets for similar tasks may help in reinforcing or discovering patterns that are pathological.
Challenges and limitations
An approach like Grad-CAM allows us to inspect regions of the ECG that contribute towards the model’s prediction. However, there are still several limitations to this approach: Grad-CAM enables us to visualize where the model is looking, but it does not tell us why. This limitation requires a human reader to extrapolate why the regions are significant to the diagnosis, which can result in confirmation bias. We’re also unable to infer how different regions of the ECG interact to affect the model’s decision. For example, if the R-R interval is an important feature used by the model it might not be possible to associate the saliency maps with this pattern. Although, even with these shortcomings, approaches like Guided Grad-CAM can serve as a clinical utility in the new era of digital biomarkers in cardiology.
Don’t miss the presentation of our latest study “Short-term prediction of atrial fibrillation from ambulatory monitoring ECG using a deep neural network” during the ESC Congress on the 27th of August at 11:15.